Real Time Device Power Meter for Home Assistant
I created a nice real-time power meter with device-level info to display on my Home Assistant dashboard. This shows the current overall power usage in the house, along with a bar chart that shows how it breaks down by appliance type. Here’s how I made it.
I display this power meter on my main dashboard, which is displayed on a wall mounted tablet in the kitchen. It’s amazing how feedback like this can nudge your behaviour towards being more power efficient!
Requirements
- Home Assistant (of course!)
- Power sensors. I previously posted about how I used Powercalc to create power and energy sensors that estimated the power usage of all the smart devices (and some dumb devices) in my house. Since then I’ve bought and installed a bunch of Shelly Plus 1PMs and Shelly 1PMs and (and some power monitoring zigbee smart plugs) to monitor the power usage of all our big dumb appliances. I also bought and installed a Shelly EM to monitor total electricity usage at main supply to the house from my consumer unit/breaker box (and I got an extra clamp to measure my electric oven / stove 32A circuit). My Home Assistant now has a near complete view of electricity usage in my house. You’ll might need something similar for this to be of use to you.
- Bar Card to drive the basic bar chart (install from HACS)
- Config Template Card to use javascript templates as values in Home Assisant YAML configuration (install from HACS if you don’t already use it).
- Custom Card Mod to define custom CSS styles for the bar chart (install from HACS if you don’t already use it)
Creating the power categories
Power sensors that are generated by Powercalc can be grouped together in the Powercalc config, which will automatically create summary sensors for the groups. For other devices, I had to make my own summary sensors. For example, I didn’t want to clutter the bar chart by showing each cooking applicance individually; instead I wanted one “cooking” sensor that contained the power usage of all those appliances.
I created some template sensors to hold the current total power usage of devices in various categories. I already had some template sensors enabled from my configuration.yaml as follows:
template:
  - sensor: !include_dir_merge_list  templates/sensors/
This allows me to define template sensors by placing them in a new file in the /config/template/sensors/ directory, as follows (/config/template/sensors/power.yaml):
- name: cooking_power
  unique_id: cooking_power
  unit_of_measurement: W
  device_class: power
  state_class: measurement
  state: >-
    {{
      states('sensor.fuse_box_energy_meter_oven_and_hob_power')|float(0)
      + states('sensor.kettle_socket_power')|float(0)
      + states('sensor.microwave_smart_plug_power')|float(0)
    }}
Creating the “Other” category
I also added a template sensor to capture the delta between the total measured power usage of the house, and the sum of all device-level power sensors (whether estimated by Powercalc or measured at the socket). This is the “other” category in the bar chart. It represents:
- discrepancies between reality and my powercalc estimates
- time discrepancy between sensors reporting in
- dumb appliances (like a hair dryer) that are being used from non-monitored sockets.
- name: unaccounted_power
  unique_id: unaccounted_power
  unit_of_measurement: W
  device_class: power
  state_class: measurement
  state: >-
    {{
      (
      states('sensor.fuse_box_energy_meter_main_power')|float(0)
      - states('sensor.all_estimated_usage_power')|float(0)
      - states('sensor.fuse_box_energy_meter_oven_and_hob_power')|float(0)
      - states('sensor.kettle_socket_power')|float(0)
      - states('sensor.microwave_smart_plug_power')|float(0)
      - states('sensor.dishwasher_power')|float(0)
      - states('sensor.washing_machine_power')|float(0)
      - states('sensor.dryer_power')|float(0)
      - states('sensor.fridge_smart_plug_power')|float(0)
      - states('sensor.tv_smart_plug_power')|float(0)
      - states('sensor.workstation_sensor_power')|float(0)
      - states('sensor.boiler_sensor_power')|float(0)
      - states('sensor.pump_sensor_power')|float(0)
      - states('sensor.comms_shelf_power')|float(0)
      - states('sensor.dining_room_socket_power')|float(0)
      )| round(1)
    }}
Creating the Power Meter Cards
I placed the power meter code in the yaml file corresponding to a dashboard that I manage manually. If I was managing dashboards from the UI (as you probably are), I would have placed the code below in “manual” cards.
The main graphic is a native gauge card, defined as follows:
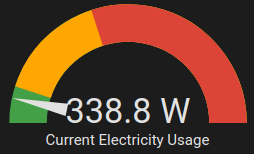
  - type: gauge
    min: 0
    entity: sensor.fuse_box_energy_meter_main_power
    name: Current Electricity Usage
    max: 5000
    needle: true
    severity:
        green: 0
        yellow: 500
        red: 2000
The animated bar chart uses Config Template Card to define an array of variables, where each item is the entity ID of a power sensor and display name. It uses Bar Card to display those sensors. The list of sensors in the Bar Card is templated (courtesy of Config Template Card) to filter the variables array so that only sensors with a current reading of greater than 5W are displayed. The maximum value of the Bar Card is also templated, so the card automatically re-scales according to the highest current power value. Custom styling is then performed (courtesy of Custom Card Mod).
It’s a shame that Config Template Card’s
entitiesarray cannot itself be templated. Config Template Card monitors this list to re-evaluate templates whenever the state of those entities change. It turns out that it needs to be a literal list, and you can’t use a template expression.
type: 'custom:config-template-card'
variables:
  - entity: sensor.cooking_power
    name: Cooking
  - entity: sensor.laundry_power
    name: Laundry
  - entity: sensor.dishwasher_power
    name: Dishwasher
  - entity: sensor.all_lights_power
    name: Lights
  - entity: sensor.fridge_smart_plug_power
    name: Fridge
  - entity: sensor.fridge_fake
    name: FakeFridge
  - entity: sensor.tv_smart_plug_power
    name: TV
  - entity: sensor.workstation_sensor_power
    name: Workstation
  - entity: sensor.boiler_sensor_power
    name: Boiler
  - entity: sensor.pump_sensor_power
    name: Pump
  - entity: sensor.comms_shelf_power
    name: Comms
  - entity: sensor.dining_room_socket_power
    name: Dining Room Socket
  - entity: sensor.estimated_device_power
    name: Estimated Devices
  - entity: sensor.unaccounted_power
    name: Other
entities:
  # Note: this list of entities may seem redundant, but is necessary to inform
  # config-template-card which entities to watch for updates.
  - sensor.cooking_power
  - sensor.laundry_power
  - sensor.dishwasher_power
  - sensor.all_lights_power
  - sensor.fridge_smart_plug_power
  - sensor.fridge_fake
  - sensor.tv_smart_plug_power
  - sensor.workstation_sensor_power
  - sensor.boiler_sensor_power
  - sensor.pump_sensor_power
  - sensor.comms_shelf_power
  - sensor.dining_room_socket_power
  - sensor.estimated_device_power
  - sensor.unaccounted_power
element:
  type: 'custom:bar-card'
  entities: |-
      ${ vars.filter(v => {
        let ent = states[v.entity];
        if(ent === undefined || ent.state === undefined) {
          console.warn(`Power meter: Entity ${v.entity} not found`);
        }
        else if(ent.state === 'unknown') {
          console.warn(`Power meter: Entity ${v.entity} state is unknown`);
        }
        else if(isNaN(ent.state)) {
          console.warn(`Power meter: Entity ${v.entity} state is not a number`);
        }
        else return Number(ent.state) > 5;
      }).sort((v1,v2) => states[v2.entity].state - states[v1.entity].state)}
    direction: right
    entity_row: true
    min: 0
    max: ${ Math.max(...vars.map(v => states[v.entity]).filter(e => !!e).map(e => e.state).filter(n => !isNaN(n))) }
  height: 20px
  stack: vertical
  decimal: 0
  icon: 'mdi:flash'
  positions:
    icon: off
    indicator: outside
    name: inside
    value: inside
  severity:
  - color: '#a1a1a18a'
    from: 0
    to: 2
  - color: '#3ea8328a'
    from: 2
    to: 10
  - color: '#85a8328a'
    from: 10
    to: 50
  - color: '#a8a4328a'
    from: 50
    to: 200
  - color: '#a887328a'
    from: 200
    to: 500
  - color: '#a867328a'
    from: 500
    to: 1000
  - color: '#a846328a'
    from: 1000
    to: 3000
  - color: '#a832328a'
    from: 3000
    to: 10000
  style: |-
    #states > * {
      margin: 1px;
    }
    bar-card-name,
    bar-card-value {
      font-size: 0.9rem;
      color: #ffffffaa;
      font-weight: bold;
    }
    bar-card-value	{
      font-weight: bolder;
    }
    bar-card-indicator {
      margin-top: 4px;
      transform: scaleY(-1);
    }